
Unless you have an LRC meter handy, measuring an inductor of unknown inductance can be a bit tricky. There are ways to estimate inductance, such as measuring the -3dB point (alt video format) or by finding the resonant frequency via an LC tank circuit. Each of these methods has pros and cons, however they are both time-consuming and lack a high-degree of precision.
The tank circuit resonant frequency is the better of the two. Fundamentally it is tracking amplitude vs frequency - aka a bode plot. Modern digital oscilloscopes often have bode plot capabilities, which provides a repeatable way to track the dip frequency of the tank circuit resonance. If your scope has this feature then you can largely automate the approach while rapidly and accurately determining the resonant frequency of the LC circuit.
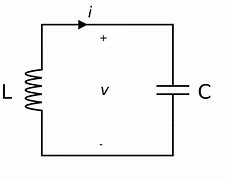
The formula for resonant frequency of an LC tank circuit is determined by the following equation.
$$f_{res} = \frac{1}{2 \pi \sqrt{L C}}$$
Solving for L we can rewrite as
$$L = \frac{1}{(2 \pi f_{res})^2 C}$$
This shows that by finding the resonant frequency of a tank circuit that you can find the value of the inductor. This assumes that you know the value of capacitance C which we can choose by picking a capacitor of known quantity.
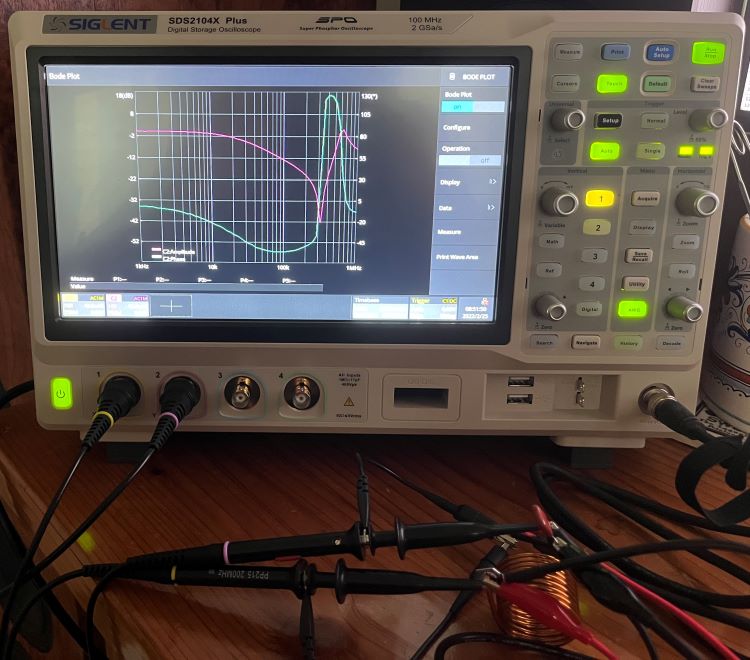
Figure 2 shows the setup that I use - aligator clips along with my scope’s built-in signal generator + bode plot functionality. Note that a 0.1μF PP capacitor which is the known reference.
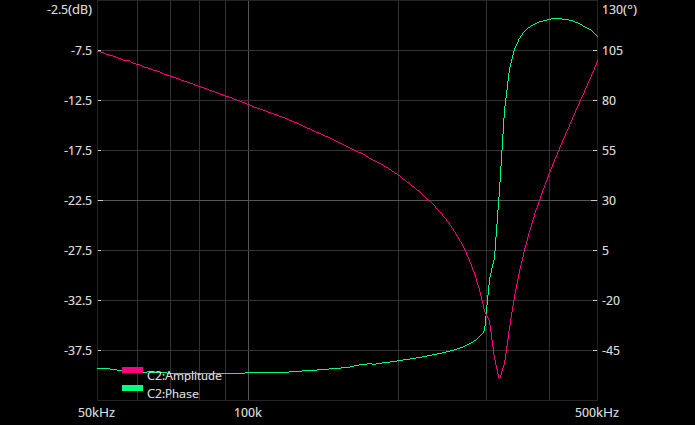
The bode plot in figure 3 is showing a minimum amplitude at around 315kHz, which corresponds to the resonant frequency of this circuit. Now we know the dip frequency along with our capacitance, let’s calculate the value for this inductor.
$$L = \frac{1}{(2 \pi f_{res})^2 C}$$ $$L = \frac{1}{(2 \pi * 315,000)^2 * 0.0000001}$$ $$L = 2.55 * 10^-6$$ $$L = 2.55 \mu H$$
And there you have it. An easy, repeatable way to calculate the value of an unknown inductor.
LTSpice
In ltspice, you can model the circuit with the following netlist
L1 N001 0 2.55µ Rser=.2
C1 N001 0 0.1µ Rser=.5
V1 N001 0 AC 1
.ac dec 10 1k 1meg
.backanno
.end
This will generate the following schematic
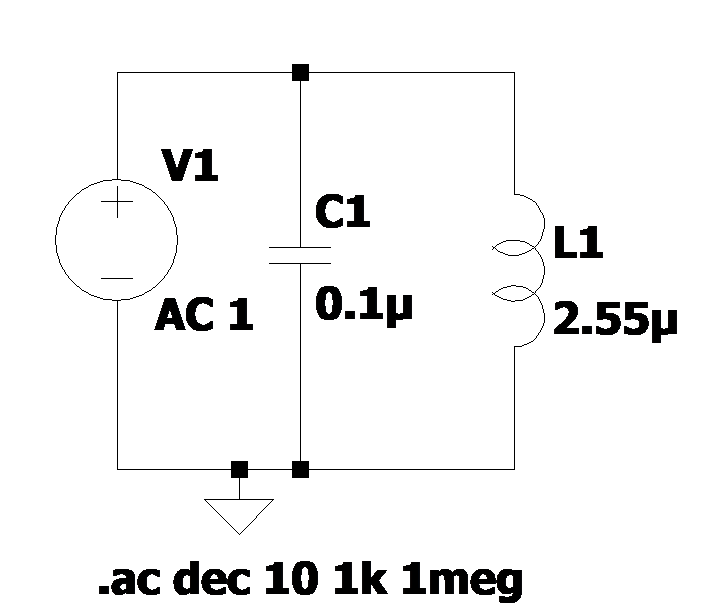
and if we perform an AC analysis on the schematic measuring current vs frequency, we get the following plot.
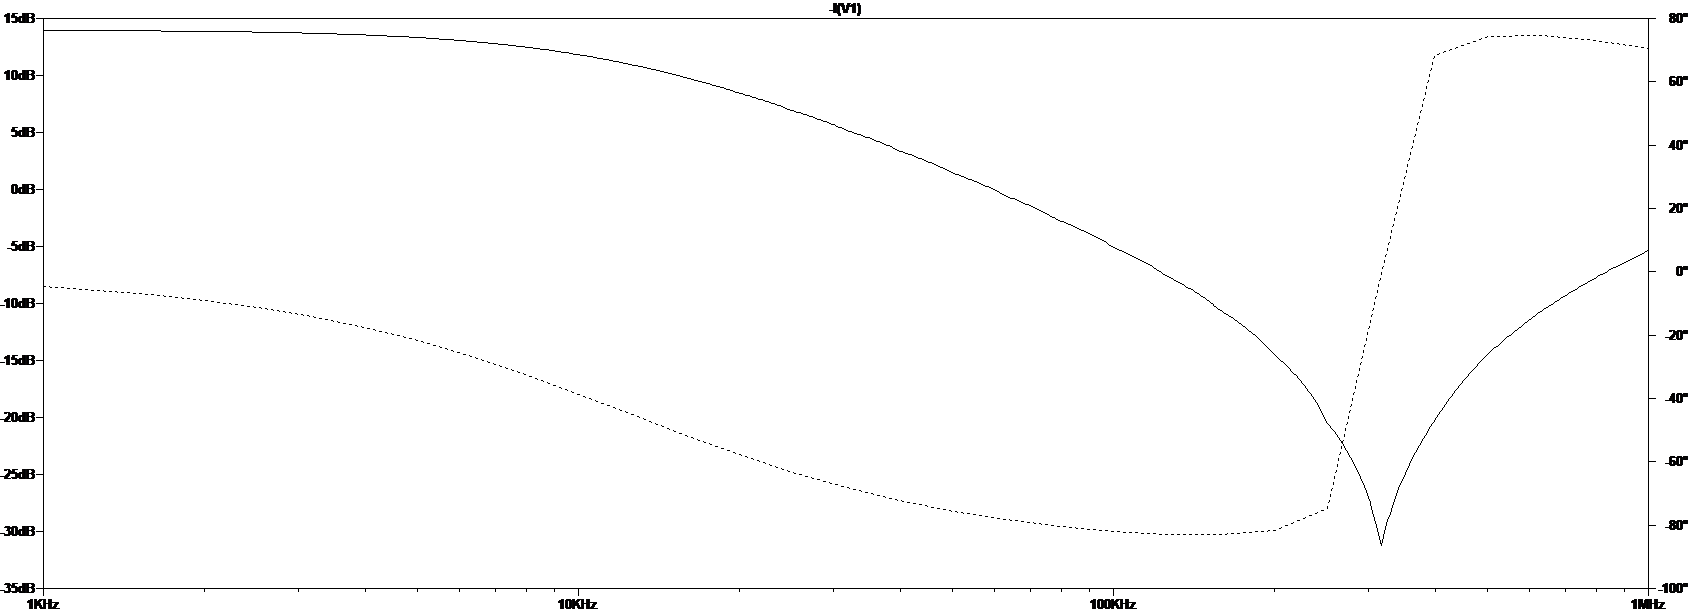
This verifies that we’re seeing the same behavior in practice as we see in simulation.